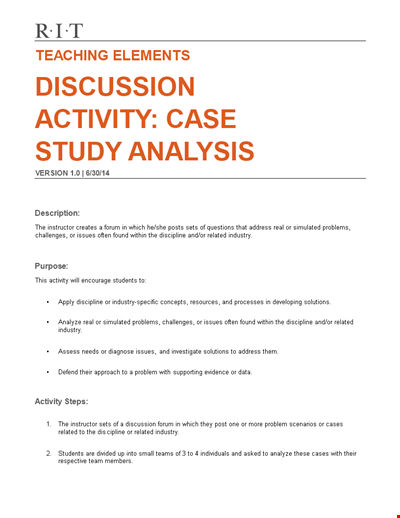
/9ae07056-3295-41ab-8ddd-a31b681022c2.png "example of horizontal financial statement analysis for effective asset evaluation Main Image")
Example of Horizontal Financial Statement Analysis for Effective Asset Evaluation
Review Rating Score
Financial statement analysis is a crucial tool for evaluating the financial health and performance of a company. Among the various methods of financial analysis, horizontal financial statement analysis is widely used to analyze trends and changes in a company's financial statements over a specific period. In this article, we will provide an example of how to perform horizontal financial statement analysis, focusing on key elements such as assets, liabilities, and equity.
Understanding Horizontal Financial Statement Analysis
Horizontal financial statement analysis involves comparing financial data from multiple periods, typically presented in a company's income statement, balance sheet, and cash flow statement. The purpose is to identify trends, patterns, and changes in financial performance over time.
An Example of Horizontal Financial Statement Analysis
Let's consider a hypothetical example of a company, XYZ Inc., and analyze its financial statements for the past three years. We will specifically focus on the key elements of assets, liabilities, and equity:
- Assets: In our analysis, we notice that XYZ Inc.'s total assets have increased steadily over the past three years. In 2018, the total assets were $1 million, which grew to $1.5 million in 2019, and further to $2 million in 2020. This indicates a positive trend in the company's asset base.
- Liabilities: From the liability perspective, we observe that XYZ Inc.'s total liabilities have also experienced a consistent increase. In 2018, the total liabilities were $500,000, which rose to $750,000 in 2019, and further to $1 million in 2020. This suggests that the company's debt obligations have also increased over time.
- Equity: By subtracting total liabilities from total assets, we can calculate XYZ Inc.'s equity. In 2018, the equity was $500,000 ($1 million assets - $500,000 liabilities), which increased to $750,000 in 2019, and further to $1 million in 2020. This indicates that the company's net worth has grown steadily.
Download the Horizontal Financial Statement Analysis Example
If you wish to dive deeper into horizontal financial statement analysis and explore the financial performance of companies in more detail, we provide a comprehensive example in PDF format. This analysis example will guide you through the process step-by-step, helping you understand the intricacies of financial statement analysis.
Visit BizzLibrary.com today to download the horizontal financial statement analysis example in PDF format. Start gaining valuable insights into the financial health of companies and make informed business decisions. Take your financial analysis skills to the next level with our comprehensive resources!
Is the template content above helpful?
Thanks for letting us know!
Reviews
Tori Harmon(8/3/2023) - USA
Great!!
Last modified
Our Latest Blog
- A Guide to Make a Business Plan That Really Works
- The Importance of Vehicle Inspections in Rent-to-Own Car Agreements
- Setting Up Your E-mail Marketing for Your Business: The Blueprint to Skyrocketing Engagement and Sales
- The Power of Document Templates: Enhancing Efficiency and Streamlining Workflows
Template Tags
Need help?
We are standing by to assist you. Please keep in mind we are not licensed attorneys and cannot address any legal related questions.
-
Chat
Online - Email
Send a message
You May Also Like
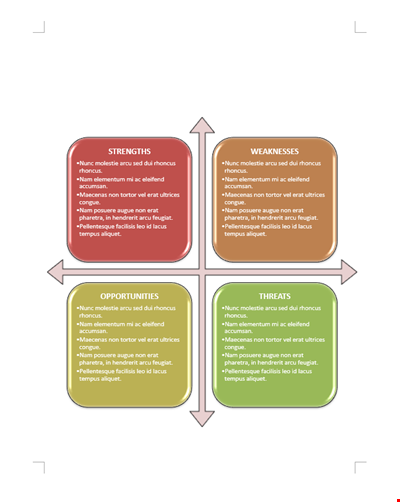
Business SWOT Analysis Template

Literary Analysis Essay Structure: HATMAT, Quote, Paragraph, Thesis Sentence
Company Situation Analysis Template - Conducting Internal and Competitive Analysis

Free Company Analysis Template - Improve Your Strategy, Analyze Stocks, and Drive Growth
Financial Analysis Template for Company Sales, Group Assets, and Ratios | Competitor Analysis
Smart Company Analysis Template - Improve your Financial Analysis with Intellidex
Service Failure Analysis Template - Analyzing System and Motor Failure with Commutator
Gap Requirements Analysis Template - Acrimas Analysis

Engineering Failure Analysis Template
Industry & Competitive Situation Analysis

Vertical Financial Statement Analysis Example
Simple Company Analysis Template

Market Analysis Template: Get Valuable Insights for Strategic Marketing
Simple Case Analysis Template | Identify Issues, Analyze Activity

Decision Tree Algorithm Template - Efficiently Analyze Decision-Making Processes
Critical Literary Analysis Template - Analyzing and Crafting a Strong Statement