/67a988a2-3f04-4cb6-be0f-791d66f9b39f.png "data analysis for likert scale survey Main Image")
Data Analysis For Likert Scale Survey
Review Rating Score
If you have conducted a Likert scale survey and are looking for an efficient way to analyze the data, you are in the right place! BizzLibrary.com offers a comprehensive data analysis template specifically designed for Likert scale surveys. With our user-friendly template in XLSX format, you will be able to analyze and interpret the survey results with ease.
Understanding Likert Scale Surveys
Likert scale surveys are a popular tool for collecting quantitative data in research studies. This survey method allows respondents to express their level of agreement or disagreement with a series of statements. The scale typically ranges from 1 to 5, with 1 representing "strongly disagree" and 5 representing "strongly agree".
Why Use a Likert Scale Survey?
Likert scale surveys offer several advantages, making them a valuable tool for gathering insights. Here's why they are widely used:
- Easy to Administer: Likert scale surveys are easy for participants to complete, as they involve rating predefined statements rather than writing open-ended responses.
- Quantifiable Data: The Likert scale provides numeric data, enabling researchers to analyze responses using statistical methods.
- Standardized and Comparable: The standardized format of Likert scale surveys allows for easy comparison of responses and identification of trends.
- Efficient Data Collection: With Likert scale surveys, large amounts of data can be collected quickly and efficiently, saving time and resources.
How to Analyze Likert Scale Data?
Analyzing Likert scale data requires a systematic approach to derive meaningful insights from the responses. Our data analysis template provides you with the tools necessary to:
- Calculate descriptive statistics, such as mean, median, and mode, to understand the central tendency of the responses.
- Generate frequency distributions and bar graphs to visualize the distribution of responses across different categories.
- Conduct inferential statistics, such as chi-squared tests or t-tests, to identify significant differences or relationships within the data.
Start Analyzing Your Likert Scale Survey Data!
Download our comprehensive data analysis template in XLSX format now and unlock the potential insights hidden within your Likert scale survey responses. Visit BizzLibrary.com today and browse our extensive collection of data analysis and research templates to support your decision-making processes.
Don't wait any longer! Optimize your data analysis process and make data-driven decisions with ease.
Is the template content above helpful?
Thanks for letting us know!
Reviews
Larita Lin(8/3/2023) - GBR
Grateful and many thanks.
Last modified
Our Latest Blog
- A Guide to Make a Business Plan That Really Works
- The Importance of Vehicle Inspections in Rent-to-Own Car Agreements
- Setting Up Your E-mail Marketing for Your Business: The Blueprint to Skyrocketing Engagement and Sales
- The Power of Document Templates: Enhancing Efficiency and Streamlining Workflows
Template Tags
Need help?
We are standing by to assist you. Please keep in mind we are not licensed attorneys and cannot address any legal related questions.
-
Chat
Online - Email
Send a message
You May Also Like
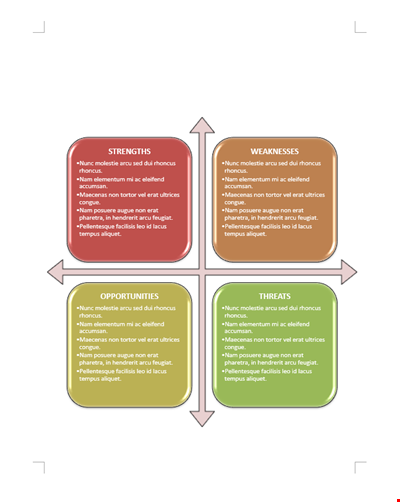
Business SWOT Analysis Template

Literary Analysis Essay Structure: HATMAT, Quote, Paragraph, Thesis Sentence
Company Situation Analysis Template - Conducting Internal and Competitive Analysis

Free Company Analysis Template - Improve Your Strategy, Analyze Stocks, and Drive Growth

Financial Analysis Template for Company Sales, Group Assets, and Ratios | Competitor Analysis

Smart Company Analysis Template - Improve your Financial Analysis with Intellidex

Service Failure Analysis Template - Analyzing System and Motor Failure with Commutator

Gap Requirements Analysis Template - Acrimas Analysis

Engineering Failure Analysis Template
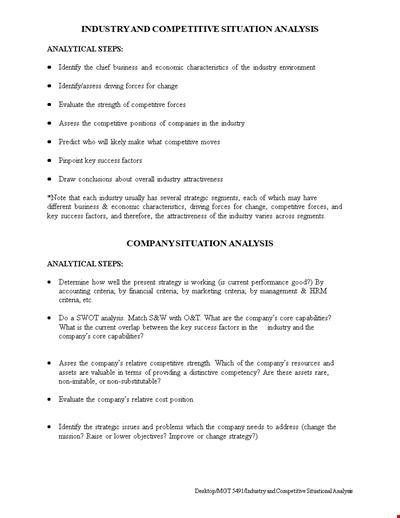
Industry & Competitive Situation Analysis

Vertical Financial Statement Analysis Example
Simple Company Analysis Template

Market Analysis Template: Get Valuable Insights for Strategic Marketing
Simple Case Analysis Template | Identify Issues, Analyze Activity

Decision Tree Algorithm Template - Efficiently Analyze Decision-Making Processes
Critical Literary Analysis Template - Analyzing and Crafting a Strong Statement