/b4f8c31d-168a-4db9-a4c5-eacb75b6d2e7.png "cycle time Main Image")
Cycle Time
Review Rating Score
If you're looking for a way to optimize your manufacturing or production processes, understanding Cycle Time is essential. At BizzLibrary.com, we've got you covered with a comprehensive Cycle Time chart template that simplifies tracking and analyzing your production data.
What is Cycle Time?
Cycle Time is the total time it takes to complete a production cycle, from start to finish. It's an essential metric for measuring the efficiency and effectiveness of your manufacturing or production processes. It can help you identify bottlenecks, inefficiencies, or waste in your operations and guide your decision-making to improve productivity and profitability.
How to use the Cycle Time Chart?
BizzLibrary.com offers a user-friendly Cycle Time chart template that puts all the essential information in one place. It features a takt time, cycle time, column, and a detailed graph that tracks your production data over time. Here's how you can use it:
- Define Your Production Cycle: Before you can start tracking your Cycle Time, you need to identify all the steps in your production cycle or process. List out all the tasks involved, identify their dependencies and sequence, and estimate the time required for each step.
- Measure Your Production Data: Start tracking your production data using a stopwatch or a timer, noting the start and end time for each production cycle. Record the data in the Cycle Time chart template, highlighting any delays or issues that impacted the production process.
- Analyze the Results: After you've collected enough data, it's time to analyze the results and identify any trends, patterns, or outliers. Compare the Cycle Time against the takt time (the ideal time required to produce one unit) to evaluate your process's efficiency. Look for bottlenecks or steps that are taking longer than expected and take steps to optimize or eliminate them.
- Improve Your Processes: Once you've identified the areas for improvement, it's time to take action. Implement changes to your production process, such as automation, streamlining, or reallocation of resources, to reduce Cycle Time and improve efficiency. Keep tracking your production data using the Cycle Time chart to evaluate the effectiveness of your interventions.
Get Your Cycle Time Chart Template
Streamline your production data tracking and analysis with our easy-to-use Cycle Time chart template in DOCX format. It's an essential tool for any manufacturer or production manager looking to optimize their processes and maximize profitability.
Visit BizzLibrary.com now to access a broad range of business document templates, including charts, graphs, legal contracts, and more. Download your Cycle Time chart template today!
Is the template content above helpful?
Thanks for letting us know!
Reviews
Rupert Pace(7/4/2023) - NZL
Thank you sir/madam!
Last modified
Our Latest Blog
- A Guide to Make a Business Plan That Really Works
- The Importance of Vehicle Inspections in Rent-to-Own Car Agreements
- Setting Up Your E-mail Marketing for Your Business: The Blueprint to Skyrocketing Engagement and Sales
- The Power of Document Templates: Enhancing Efficiency and Streamlining Workflows
Template Tags
Need help?
We are standing by to assist you. Please keep in mind we are not licensed attorneys and cannot address any legal related questions.
-
Chat
Online - Email
Send a message
You May Also Like
Sample Leadership Retreat
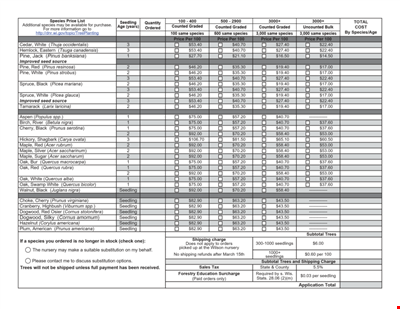
Seedling Price List - Affordable Saplings for Your Garden | Buy Best Quality Seedlings Online
Colored College Ruled Paper

College Ruled A Size Paper Template
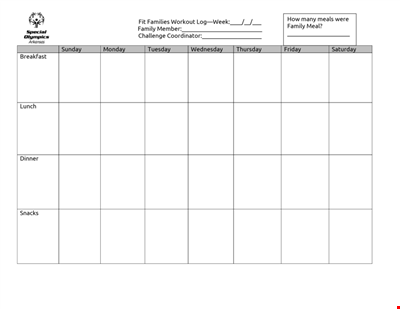
Get Fit as a Family with our Printable Workout Log | Track your progress and stay motivated
Download Beautiful Birth Announcement Template
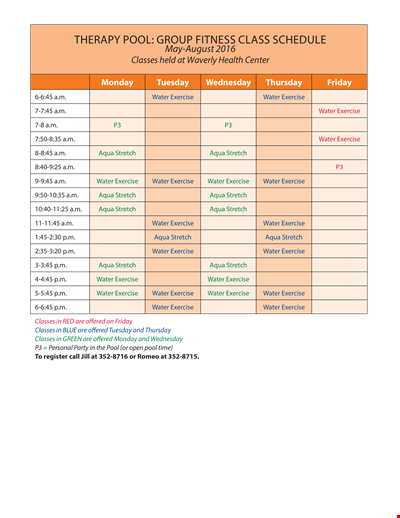
Fitness Therapy Schedule Template - Water, Exercise Classes, Stretch
Excellence in Education

Download MLA Reference Style Format: The Ultimate Guide with Examples
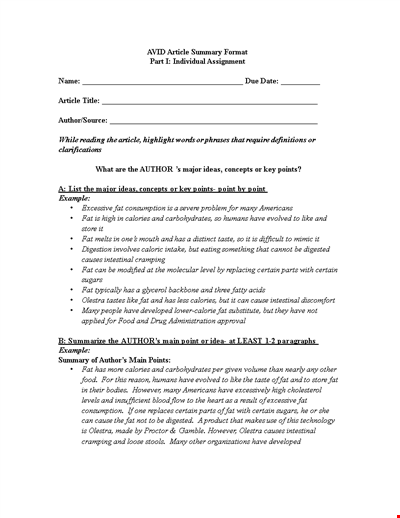
Sample Article Summary Template - Write Effective Summaries Easily
Festival Agenda A4

Fact Sheet Template - Health, Water, Copper, Drinking Levels
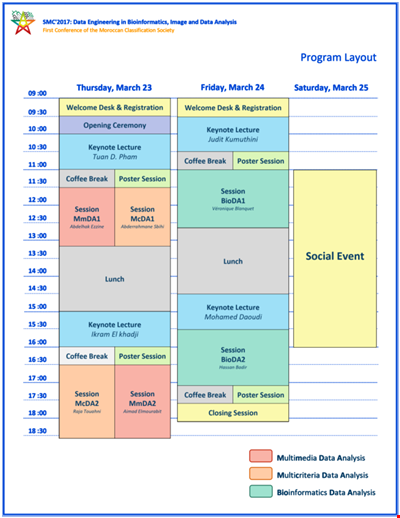
Social Event Program Layout
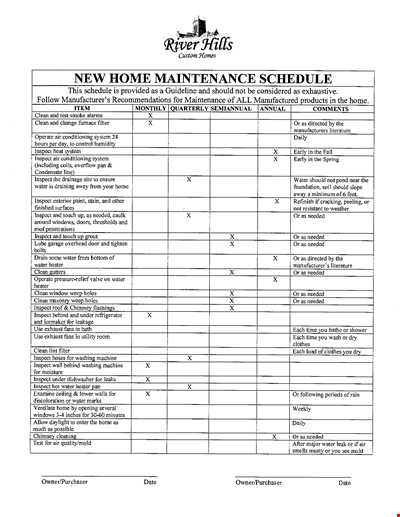
Organize Your Home Maintenance with our New Template

Church Leadership Qualities Example

Non Profit Board Agenda