/9693a491-1992-48b2-85b7-94f6145c8e17.png "sales analysis with pareto chart for product improvement Main Image")
Sales Analysis with Pareto Chart for Product Improvement
Review Rating Score
Are you looking to analyze your product sales data and improve your business's efficiency? One of the most effective tools for identifying your top-performing products is the Pareto Chart. At BizzLibrary.com, you can download our Pareto Chart template in XLSX format and gain valuable insights into your sales trends.
Understanding the Pareto Chart
The Pareto Chart is a graphical representation of the Pareto principle, which states that 80% of effects come from 20% of causes. In the context of product sales analysis, the Pareto principle can be applied to identify the top 20% of products that account for 80% of total sales. This enables businesses to focus their efforts on the most profitable products and maximize their revenue potential.
How to Use the Pareto Chart Template
Our Pareto Chart template is designed to help businesses analyze their sales data and identify the top-performing products. Here's a step-by-step guide to using our template:
- Enter Your Sales Data: Add your product sales data to the "Product Data" sheet in the template. Make sure to include the product name, sales figures, and any other relevant details.
- View Your Pareto Chart: The template will automatically generate your Pareto Chart on the "Pareto Chart" sheet, showing you the top-performing products based on their sales figures.
- Make Data-Driven Decisions: Analyze the Pareto Chart to determine which products are driving the majority of your sales. Use this information to make informed decisions about product development, pricing, marketing, and inventory management.
Download Our Pareto Chart Template
Unlock the power of the Pareto Chart and gain valuable insights into your product sales. Our Pareto Chart template is available for download in XLSX format, making it easy to use with Microsoft Excel or other spreadsheet software. Visit BizzLibrary.com today to download your copy and start optimizing your business's performance!
Is the template content above helpful?
Thanks for letting us know!
Reviews
Kassandra Mcfarland(6/28/2023) - DEU
Materials I just received from you are useful.
Author. Content was provided by:
Elizabeth Davis
Elizabeth is from the sunny desert city of Phoenix, Arizona. She is thrilled to connect with professionals and like-minded individuals who share a passion for social technologies, content creation, and the exciting possibilities that AI brings to the world of social media. Her hobbies are hiking, climbing, and horse riding. Elizabeth has a master's degree in Social Technologies that she received at the ASU (Arizona State University). As a freelancer, she mostly contributes content related to IT. This includes articles on templates and forms provided by our community.
Follow Elizabeth
Last modified
Our Latest Blog
- The Importance of Vehicle Inspections in Rent-to-Own Car Agreements
- Setting Up Your E-mail Marketing for Your Business: The Blueprint to Skyrocketing Engagement and Sales
- The Power of Document Templates: Enhancing Efficiency and Streamlining Workflows
- Writing a Great Resume: Tips from a Professional Resume Writer
Template Tags
Need help?
We are standing by to assist you. Please keep in mind we are not licensed attorneys and cannot address any legal related questions.
-
Chat
Online - Email
Send a message
You May Also Like
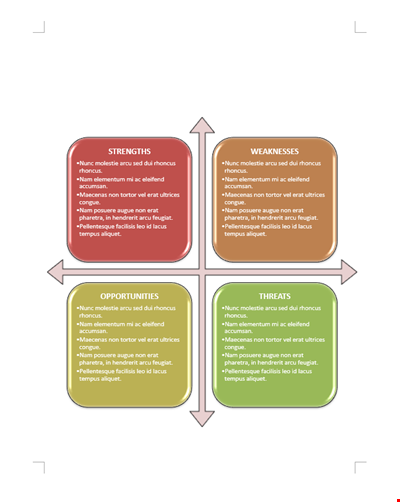
Business SWOT Analysis Template

Literary Analysis Essay Structure: HATMAT, Quote, Paragraph, Thesis Sentence
Company Situation Analysis Template - Conducting Internal and Competitive Analysis

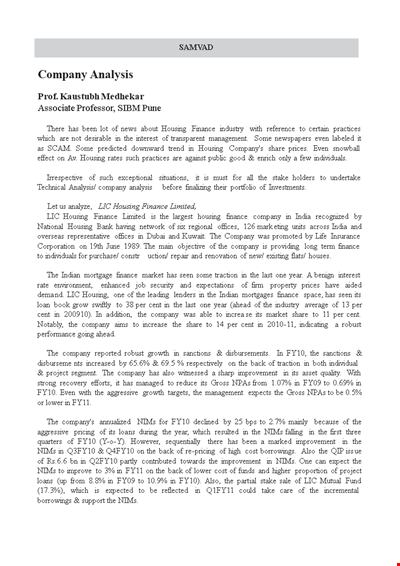
Free Company Analysis Template - Improve Your Strategy, Analyze Stocks, and Drive Growth
Financial Analysis Template for Company Sales, Group Assets, and Ratios | Competitor Analysis
Smart Company Analysis Template - Improve your Financial Analysis with Intellidex
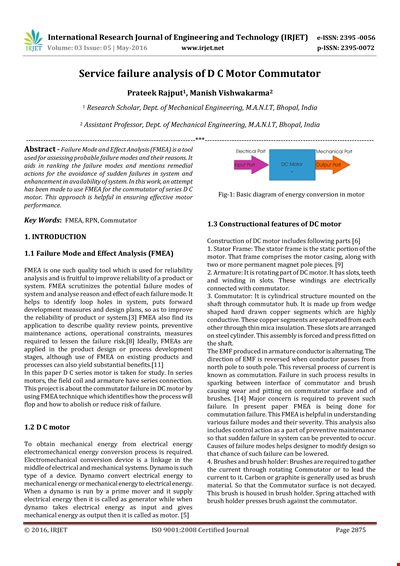
Service Failure Analysis Template - Analyzing System and Motor Failure with Commutator
Gap Requirements Analysis Template - Acrimas Analysis

Engineering Failure Analysis Template
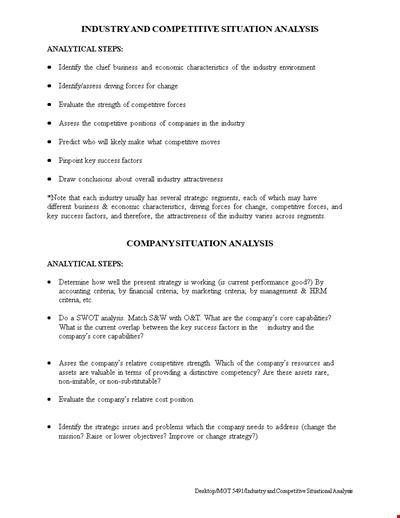
Industry & Competitive Situation Analysis

Vertical Financial Statement Analysis Example
Simple Company Analysis Template

Market Analysis Template: Get Valuable Insights for Strategic Marketing
Simple Case Analysis Template | Identify Issues, Analyze Activity
Decision Tree Algorithm Template - Efficiently Analyze Decision-Making Processes
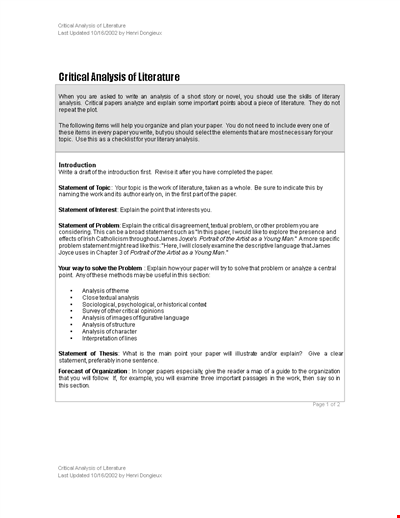
Critical Literary Analysis Template - Analyzing and Crafting a Strong Statement