


Gantt Chart Template
Review Rating Score
A Gantt chart is a very popular planning tool that is often used to manage projects and to provide to the management/project board a status update. Learn more about the advantages and disadvantages of the Gantt Chart and download a sample chart in Word directly.
How do I create a Gantt chart in Word?
Often, such a planner chart tool consists of just 4 basic components, like:
- Task names (description of the task or activity);
- Taskbars (the start date and lead time for the task or activity);
- Milestones, (A milestone marks the end of a piece of work or phase of the project. They are often fixed dates with or important dates that you need to be aware);
- Dependencies, how tasks group together, overlap, and link with each other? (Tasks that can only start and finish, or are directly impacted, if another task is finished before them. Therefore it’s common to add a number in the column This is often an easier way of quickly finding out which task links where. Use the numbers in this column to track back the task dependencies – it can be faster than trying to trace a spidery line on the Gantt chart.).
The great advantage of a Gantt chart is that they take complex project information and organize it in a visual way that is easy to understand. This can help to increase the project teams’ productivity and to accomplish the milestones within the time required with the resources available. For example, it’s very easy and quick to see the following important characteristics that can be deducted from a Gantt Chart:
- Project start date (planned start date that you aim to start working on the task);
- Project finish date (the date the project is delivered successfully):
- Assigned / Owner; Who is working on a task? This column tells you the name of the person or role/resource (supplier) who has been allocated to work on the task. At the start of the project you may only have resource type but as you go through you should be able to replace this with the names of actual team members;
- When will tasks be implemented (start and finish, or planned duration: a single number that reflects how many days there are between the planned start date and the planned finish date. It is based on working days, so if a task is planned to take a week it will reflect the amount of (working) days);
- Which tasks are executed? ; percent complete: A figure, mostly always based on an educated guess by the person doing the task, of how much work they have done and how much is still to do;
- How long each task will take? An important suggestion for project managers is that you always need to be aware of activities that stay at 85-90% complete status for too long. Usually, this is a sign that the task owner does not exactly know how much work there is still to do. Each time an update is provided, the percent complete should move up, unless no work has actually taken place. Monitoring this ‘percent complete’ indicator is a good way to get an early warning about tasks that might run late;
- Planned effort: How many hours of work the task will take within the duration. Think about painting a wall. It might only take you an hour to paint the first coat but then you’ve got to leave it two hours to dry before the next coat. Then you paint again and leave it to dry again. That’s only two hours of the actual painting (effort) but six hours in total (duration);
Just download this ready-made Gantt Chart template in Google Docs, MS Word or Apple Pages format and you’re good to go. Open it, modify it, or print it directly. An alternative Gantt Chart Excel Template can be found here.
Is the template content above helpful?
Thanks for letting us know!
Reviews
Donnette Kennedy(6/19/2022) - GBR
This is exactly what I’ve been wanting, thank you so much
Frederick L(6/19/2022)
Super slick Gantt chart thank you
Hyon Harmon(6/19/2022) - USA
Thank you for the document, it will help me get everything I need
Jorge Mullins(6/19/2022) - DEU
I can tell you this file is very suitable
Gerda Larsen(6/19/2022) - NZL
Thank you for this!!
Leopoldo Mccullough(6/19/2022) - GBR
Thank you for your time providing this sample document that is exactly what I was looking for.
Jodee Small(12/7/2021) - USA
Your file provided me a solution for the situation I am in
Heriberto Mclaughlin(12/7/2021) - USA
Simply Sublime document :)
Lydewy Brand(12/7/2021)
Great Gantt chart. Thanks for helping me out
Gand d(12/7/2021)
Gantt chart is nice
L L(12/7/2021)
Great gantt chart template
Lecia Best(12/7/2021) - USA
Grateful!!
Dione Friedman(12/7/2021) - NZL
I share a suggestion: Please continue the Excellent work, we all benefit from it.
Rudy Barry(12/7/2021) - DEU
Grateful!!
Last modified
Our Latest Blog
- A Guide to Make a Business Plan That Really Works
- The Importance of Vehicle Inspections in Rent-to-Own Car Agreements
- Setting Up Your E-mail Marketing for Your Business: The Blueprint to Skyrocketing Engagement and Sales
- The Power of Document Templates: Enhancing Efficiency and Streamlining Workflows
Template Tags
Need help?
We are standing by to assist you. Please keep in mind we are not licensed attorneys and cannot address any legal related questions.
-
Chat
Online - Email
Send a message
You May Also Like
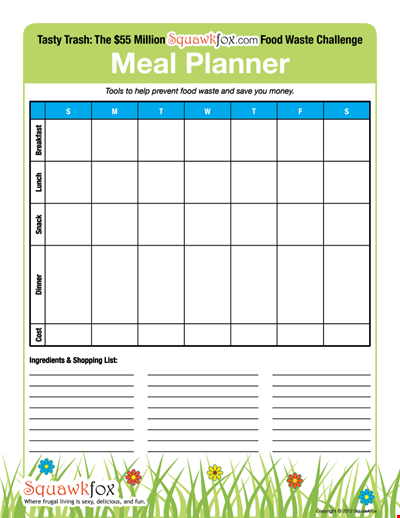
Create an Efficient Meal Planning Calendar for Easy Meal Preparation
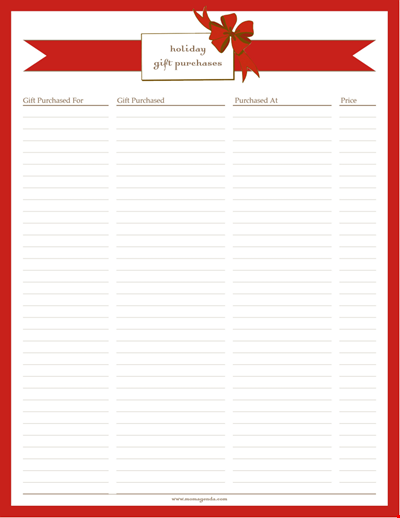
Organize Your Holiday Gift Purchases with our Template
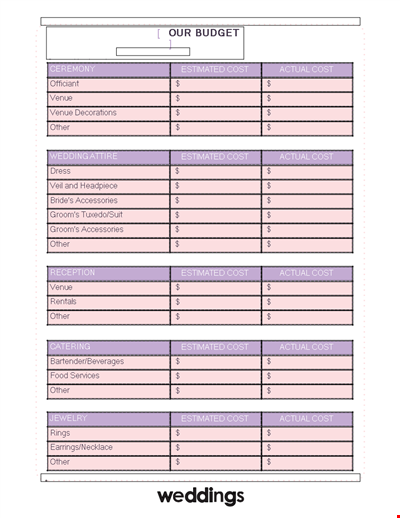
Create a Cost-Effective Wedding Budget Spreadsheet - Manage your Expenses
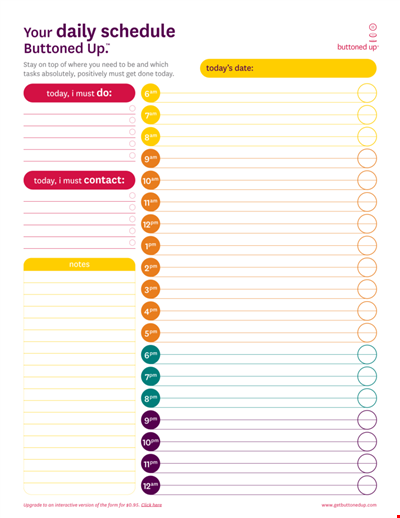
Printable Daily Agenda Planner
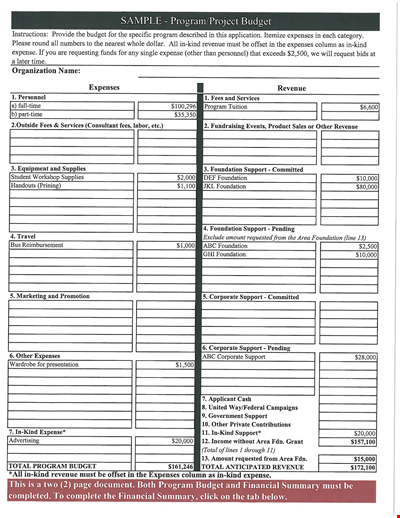
Budget Template for Program and Project Management | Cost Tracking and Analysis

Sample Nightclub Business Plan
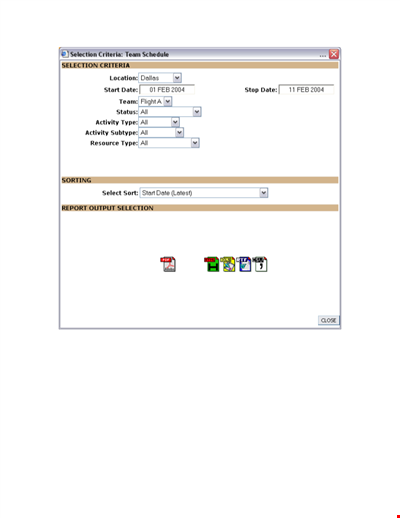
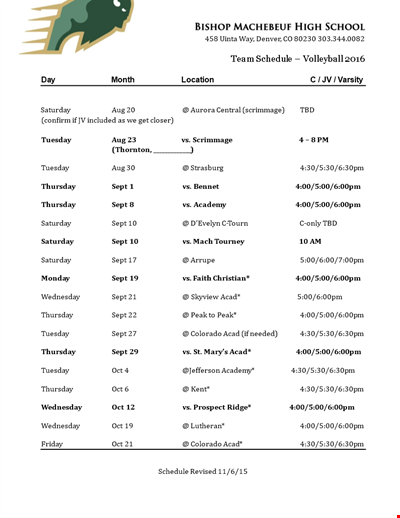
Team Schedule Template
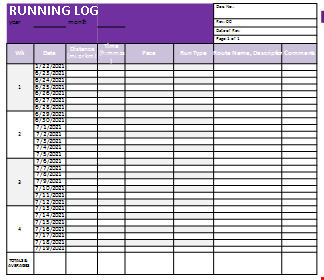
Running Log in Excel
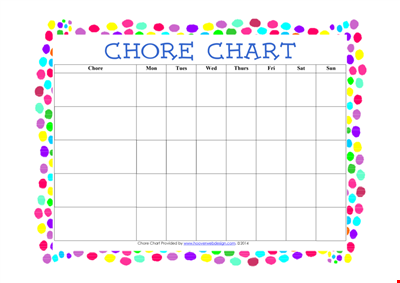
Free Blank Chore
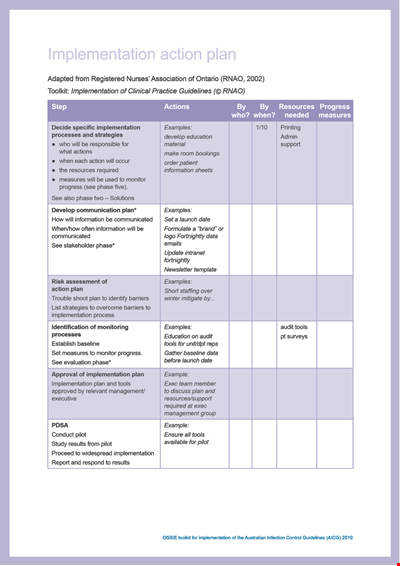
Implementation Action Plan Template - Streamline Your Project Execution
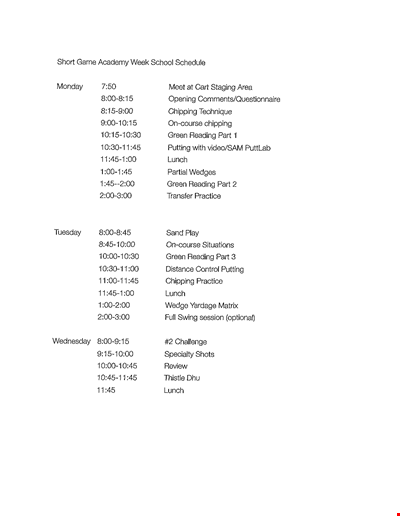
Week School Schedule Template

High School Weekly Lesson Plan Template
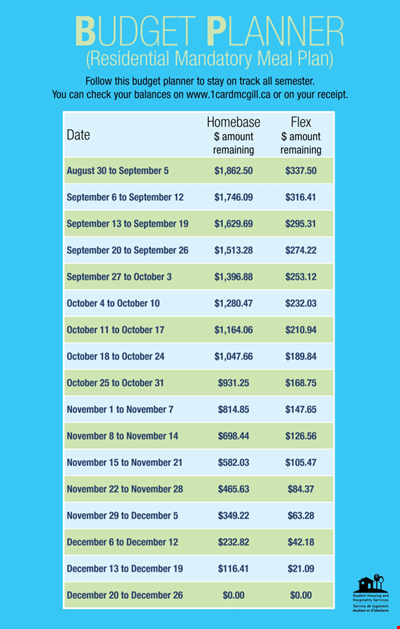
Free Meal Budget Planner
Create an Efficient Team Schedule for Saturday
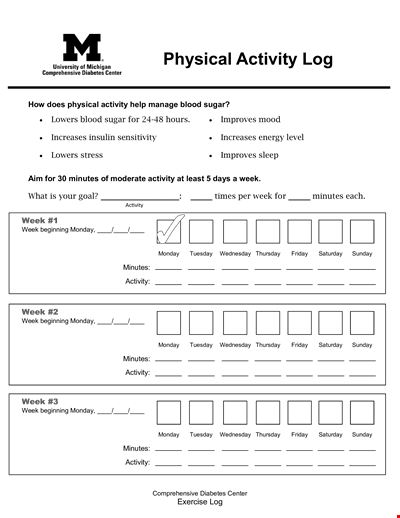
Track Your Diabetes Exercise Progress with this Monday Activity Log - Beginning with Minutes
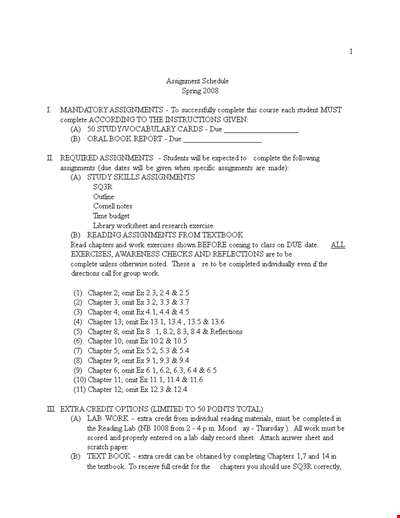
Assignment Schedule Template - Organize Your Class Assignments by Chapter