/ae21e843-1d0f-4282-be19-48d1bf40d43e.png "efficient t chart templates for planning and decision making | free & editable options Main Image")
Efficient T Chart Templates for Planning and Decision Making | Free & Editable Options
Review Rating Score
Everybody is acquainted with the power of a good comparison before you make a decision. T charts will become handy. Not everybody uses the terminology T-chart. Other common names are T-graph or T-table. T-charts are very useful to help you solve your problems and equations and to make calculated decisions.
How do you make a T Chart in Excel?
Making a T-chart is easy, you just create 2 dividing lines in the shape of a T. This is a simple and great organizational tool to help you solve equations with more than one variable. This is one way to help solve equations with variables, which are any unknowns in an equation or formula. If you want to make a T-chart in Excel, you can easily select the area that you wish to use to make your comparison. Begin by writing down two subjects you would like to compare. These are placed on both sides of the table and will form the headings of your T chart. Consider making these two top cells bold so that you can distinguish them from the bulk of your data. Then the next step is to (equally) divide the space into 2, and separate both areas by 1 thicker line vertically through the middle.
How to use a T Chart in Excel?
Whenever you have equations with unknowns, you can use a T-chart to organize and solve problems. Each side of the scheme represents a variable, or unknown. Then you can start filling them into two different cells in the top row of your excel spreadsheet. The left part of the chart is the one we call the independent variable since it does not matter which real number we choose. On the right side, we call the dependent variable since it depends on what we choose for the independent variable. By using each field or line, we can fill in the items we like to compare. You may circle those that you prefer if you wish to add another dimension to your table. By circling your choice or preference, you will see a total overview of which side of the chart has the most likable outcomes.
The great thing about such a simple T-chart graph where two columns are used to solve underlying problems of comparison is that it instantly organizes and structures the information that is already in your head. It helps you clean up and progress on your decision. By showing those two variables and their outcomes in 1 clear overview.
T-charts in documents are used for the following purposes:
- Breaks down personal or business' expenses and assets;
- In mathematics, T-charts are commonly used to make linear and/or quadratic comparisons, or equations, in a graph. In other instances;
- Discuss the characteristics of a specific topic so that these characteristics can be provided with the ideas that are linked to them;
- Lists problems and its corresponding solutions;
- Creates a comparison of the advantages and disadvantages that you may experience in creating a decision;
- Lists strengths and weaknesses of a business plan, blueprint, or document that is being assessed or analyzed;
- Lists opportunities and threats of a plan;
- Lists real facts vs false or fictional suggestions in an article review;
- Can list personal traits and opposite characteristics of a personality;
- List down the positive and negative results or outcomes of different procedures;
- Makes it easier to understand long documentation and discussions about a few variables;
- Any other variables that you want to compare...
If you weren't acquainted with T-charts before, we hope you are convinced to start using them more often, or even on a daily basis. They will help you to visualize and organize data in an easily identifiable way so you can make decisions that make you more effective. Format of T-charts are user friendly, so it can be used by people of different ages who have different concerns. It helps to get a good grip on the subject matter because of the structure and how the data is visualized.
Let's look at this example T Chart Excel template that we prepared for you. Download this printable T Chart as an spreadsheet directly and start comparing it to enable yourself to make the right decision.
Is the template content above helpful?
Thanks for letting us know!
Reviews
Jenice Serrano(3/16/2022) - DEU
Will use the website more and recommended it to my friends.
Kandis Singleton(3/16/2022) - GBR
Was able to deliver results quickly
Faustino Herrera(3/16/2022) - USA
Highly recommended
Althea Huerta(12/7/2021) - DEU
I shared this file with friends and bookmarked your site
Lisabeth Ramos(12/7/2021) - NZL
Very handy!
Renea Lowery(12/7/2021) - NZL
Thank you!!
Rebeca Yu(12/7/2021) - AUS
Endorsed teh document and page to my network
Last modified
Our Latest Blog
- The Importance of Vehicle Inspections in Rent-to-Own Car Agreements
- Setting Up Your E-mail Marketing for Your Business: The Blueprint to Skyrocketing Engagement and Sales
- The Power of Document Templates: Enhancing Efficiency and Streamlining Workflows
- Writing a Great Resume: Tips from a Professional Resume Writer
Template Tags
Need help?
We are standing by to assist you. Please keep in mind we are not licensed attorneys and cannot address any legal related questions.
-
Chat
Online - Email
Send a message
You May Also Like
Sample Leadership Retreat
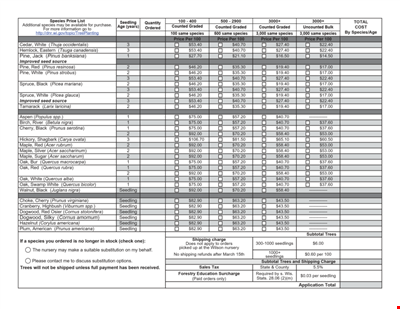
Seedling Price List - Affordable Saplings for Your Garden | Buy Best Quality Seedlings Online
Colored College Ruled Paper

College Ruled A Size Paper Template
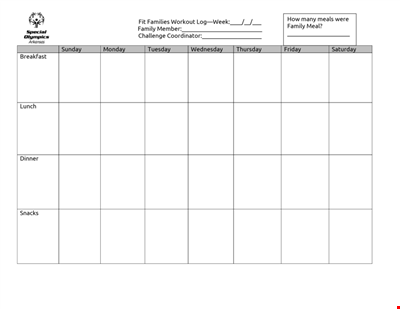
Get Fit as a Family with our Printable Workout Log | Track your progress and stay motivated
Download Beautiful Birth Announcement Template
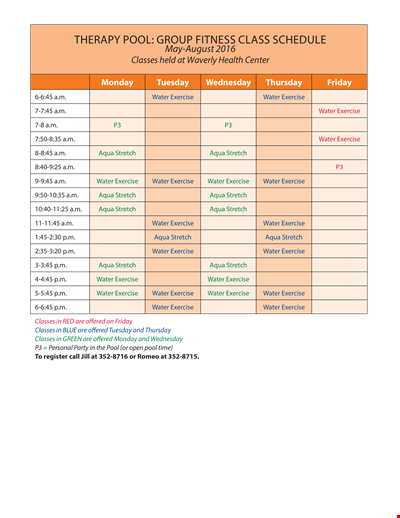
Fitness Therapy Schedule Template - Water, Exercise Classes, Stretch
Excellence in Education

Download MLA Reference Style Format: The Ultimate Guide with Examples
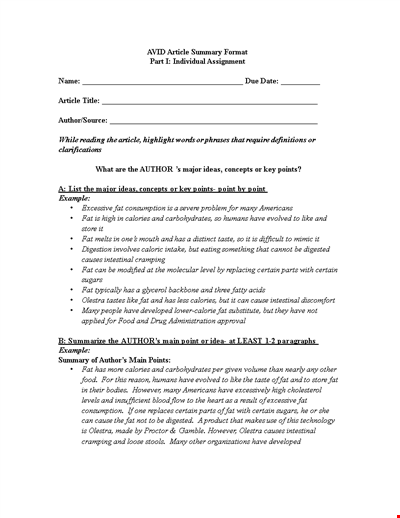
Sample Article Summary Template - Write Effective Summaries Easily
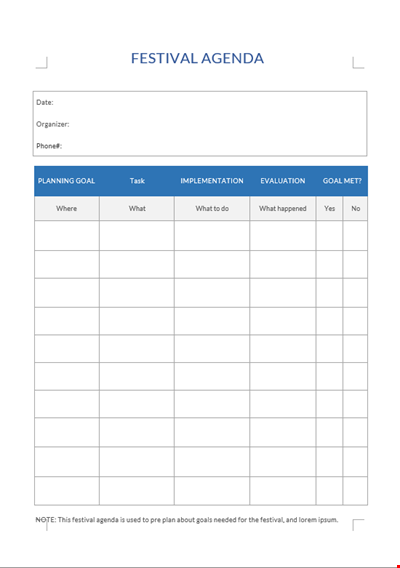
Festival Agenda A4

Fact Sheet Template - Health, Water, Copper, Drinking Levels
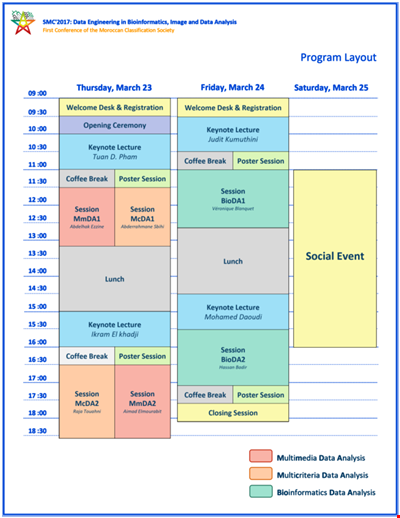
Social Event Program Layout
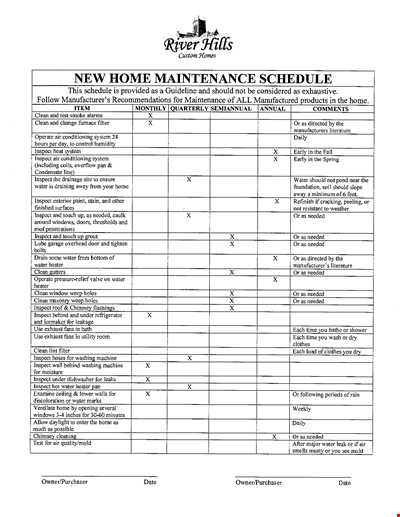
Organize Your Home Maintenance with our New Template

Church Leadership Qualities Example

Non Profit Board Agenda