/f91a97d1-2bed-4421-beb3-fa138ad2280f_1.png "t chart template Main Image")
T Chart template
Review Rating Score
Everybody is acquainted with the power of T charts. Not everybody uses the terminology T-chart. Other common names are T-graph or T-table. T-charts are very useful to help you solve your problems and equations and to make calculated decisions.
How do you make a T chart in Excel?
Making a T-chart is easy, you just create 2 dividing lines in the shape of a T. This is a simple and great organizational tool to help you solve equations with more than one variable. This is one way to help solve equations with variables, which are any unknowns in an equation or formula. If you want to make a T-chart in Excel, you can easily select the area that you wish to use to make your comparison. Begin by writing down two subjects you would like to compare. These are placed on both sides of the table and will form the headings of your T chart. Consider making these two top cells bold so that you can distinguish them from the bulk of your data. Then the next step is to (equally) divide the space into 2, and separate both areas by 1 thicker line vertically through the middle.
How to use a T-Chart?
Whenever you have equations with unknowns, you can use a T-chart to organize and solve problems. Each side of the scheme represents a variable, or unknown. Then you can start filling them into two different cells in the top row of your excel spreadsheet. The left part of the chart is the one we call the independent variable since it does not matter which real number we choose. On the right side, we call the dependent variable since it depends on what we choose for the independent variable. By using each field or line, we can fill in the items we like to compare. You may circle those that you prefer, if you wish to add another dimension to your table. By circling your choice or preference, you will see a total overview of which side of the chart has the most likable outcomes.
The great thing about such a simple T-chart graph where two columns are used to solve underlying problems of comparison is that it instantly organizes and structures the information that is already in your head. It helps you clean up and progress on your decision. By presenting those two variables and their outcomes in 1 clear overview.
T-charts are used for the following purposes:
- breaks down an individual or a company’s expenses and assets;
- In mathematics, T-charts are commonly used to make linear and/or quadratic comparisons, or equations, in a graph. In other instances;
- Discuss the characteristics of a specific topic so that these characteristics can be provided with the ideas that are linked to them;
- Lists problems and its corresponding solutions;
- Creates a comparison of the advantages and disadvantages that you may experience in creating a decision;
- Lists strengths and weaknesses of a business plan, blueprint, or document that is being assessed or analyzed;
- Lists opportunities and threats of a plan;
- Lists real facts vs false or fictional suggestions in an article review;
- Can list personal traits and opposite characteristics of a personality;
- List down the positive and negative results or outcomes of different procedures;
- Makes it easier to understand long presentations and discussions about a few variables;
- Any other variables that you want to compare...
If you weren't acquainted with T-charts before, we hope you are convinced to start using them more often, or even on a daily basis. They will help you to present data in an easily identify way so you can make decisions that make you more effective. Format of T-charts are user friendly, so it can be used by people of different ages who have different concerns. It helps to get a good grip on the subject matter because of the structure and how the data is visualized.
Let's look at this example T chart Excel spreadsheet that we prepared for you. Download this printable T Chart as an MS Excel spreadsheet directly and start comparing it to enable yourself to make the right decision.
Is the template content above helpful?
Thanks for letting us know!
Reviews
Meri Bradshaw(11/16/2020) - USA
Very grateful to find this file and website.
Maile Caldwell(11/16/2020) - AUS
Materials I just received from you are very useful!!
Last modified
Our Latest Blog
- The Importance of Vehicle Inspections in Rent-to-Own Car Agreements
- Setting Up Your E-mail Marketing for Your Business: The Blueprint to Skyrocketing Engagement and Sales
- The Power of Document Templates: Enhancing Efficiency and Streamlining Workflows
- Writing a Great Resume: Tips from a Professional Resume Writer
Template Tags
Need help?
We are standing by to assist you. Please keep in mind we are not licensed attorneys and cannot address any legal related questions.
-
Chat
Online - Email
Send a message
You May Also Like
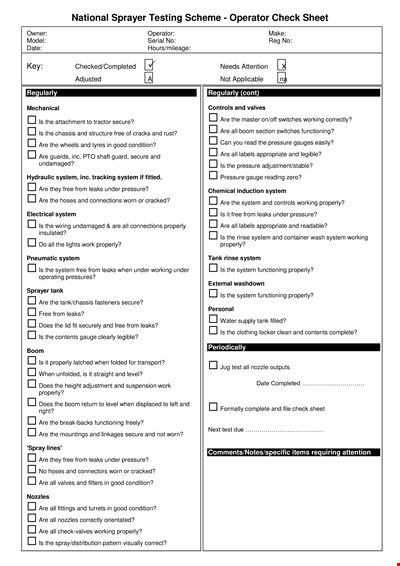
Nsts Operator Check Sheet Template
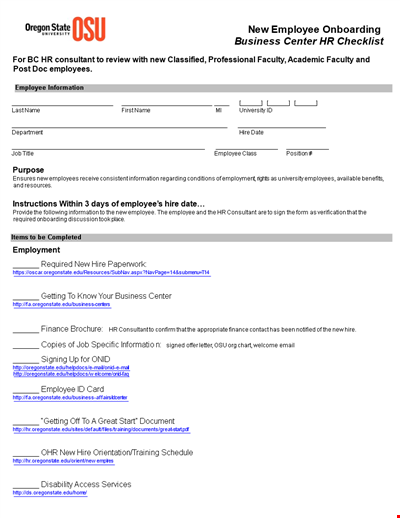
Sample New Employee Onboarding Business Center Hr Checklist
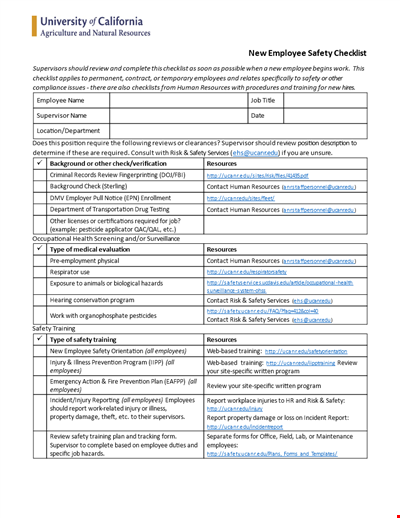
New Employee Safety Checklist Template - Comprehensive Safety Training | UCANR
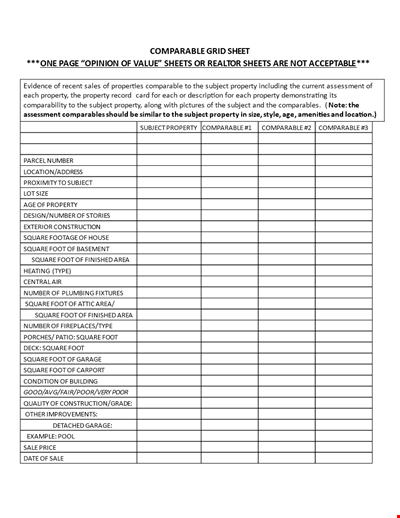
Home Sales Comparable Grid Sheet Template
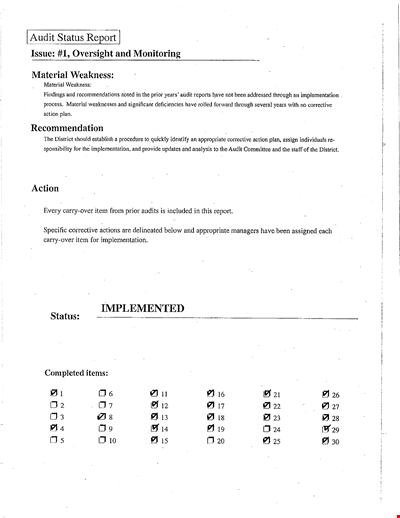
Check the Status of Your Audit with Our Sample Audit Status Template
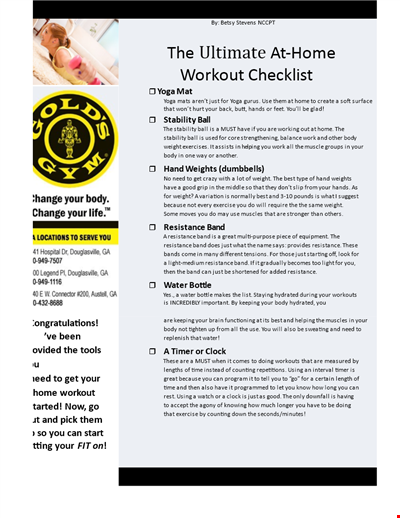
Home Workout Checklist Template
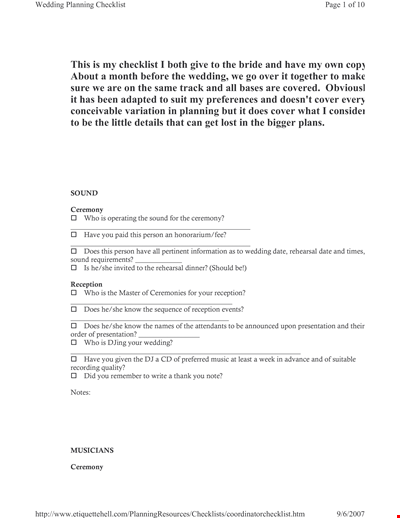
Wedding Day Coordinator Checklist
House Construction To-Do List Template | Easily Manage Tasks and Assignments

Psychotropic Medication Checklist for Diagnosis and Medications
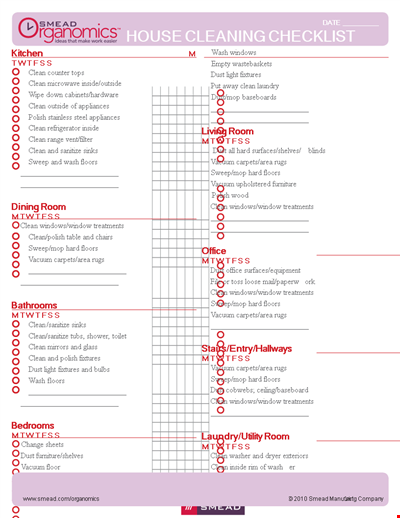
Printable House Cleaning Checklist | Free PDF Format - Clean Floors, Sweep

Project Items Checklist Template for Efficient Project Management and Inspection
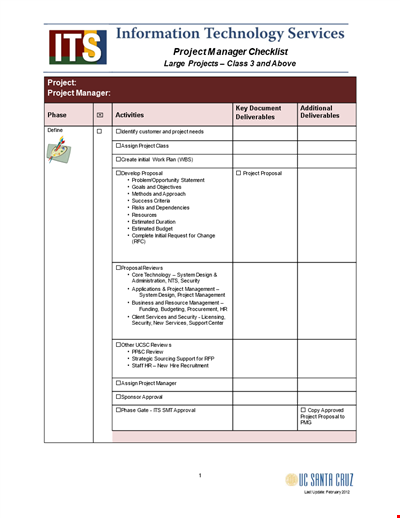
Download IT Project Manager Checklist Template - Simplify Project Management & Budget
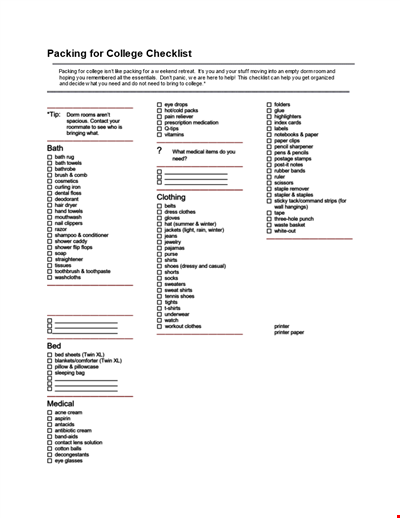
College Packing Checklist: What to Bring for a Successful College Adventure
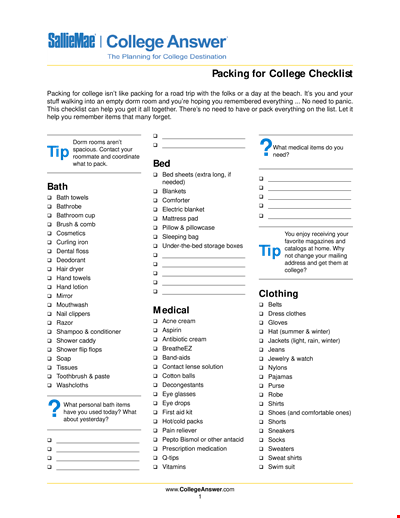
Ultimate College Packing Checklist: Essential Items for College Students

Checklist for Child Aggressive Behavior: Activities, Tasks & Troubles
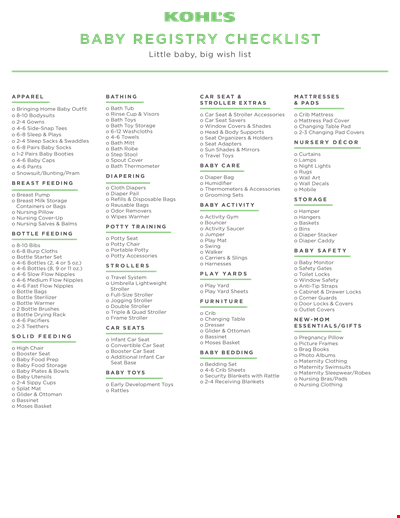
New Baby Registry Checklist: Must-Have Items for Your Baby, Including Bottles and Strollers